
Introduction:
The epidemic of drug overdoses in the USA has been growing at an exponential rate for four decades; counts of overdose deaths have doubled approximately every eight years. The graph below plots the number of deaths per year for the entire USA, with a fitted exponential curve.
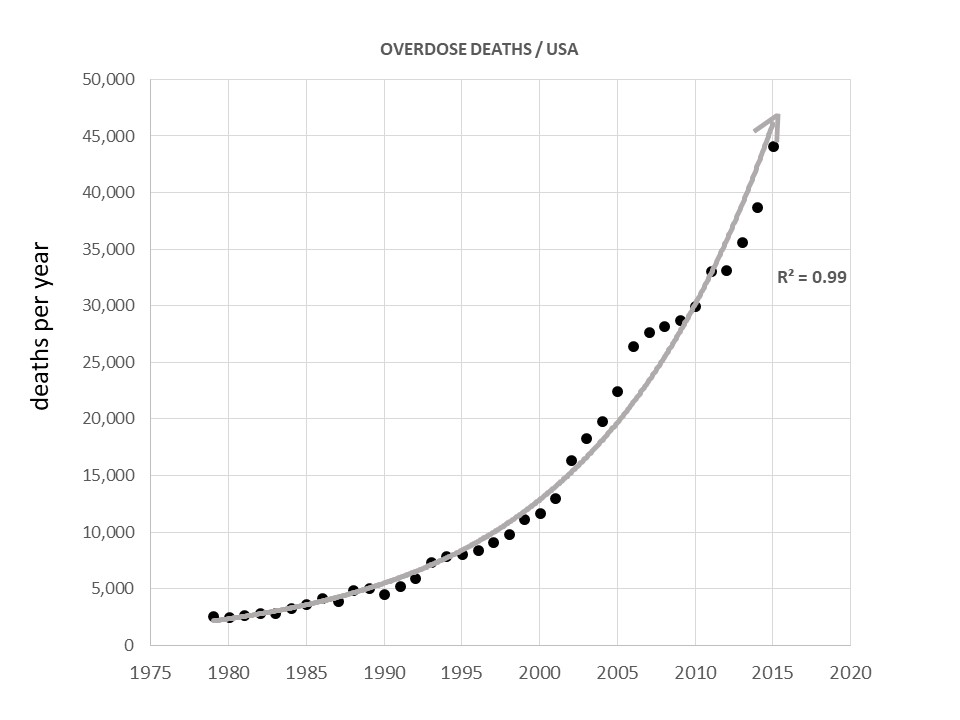
Graph: United States Overdose Death Counts (1979-2015)
This web site provides graphs of the number of deaths per year for all 50 states and 43 large cities.
Methods:
All reported accidental poisoning deaths were abstracted for the period 1979 to 2015 from the death record reports provided by the US National Center for Health Statistics and maintained in the MOIRA death record repository at the University of Pittsburgh. Cases were identified as those carrying codes for accidental poisoning in the 9th or 10th revisions of the International Classification of Diseases (ICD-9 codes E850 to E858 for 1979-1998, and ICD-10 codes X40 to X44 for 1999-2015). These codes included all drug poisonings but excluded alcohol and organic solvents and halogenated hydrocarbons and their vapors, other gases and vapors, pesticides, unspecified chemicals and noxious substances. For the purpose of this report we refer to the included accidental poisoning deaths collectively as drug overdose deaths. Population counts and age distributions were abstracted from the US Census. Overdose deaths per year were tabulated for the entire USA, for all 50 states and the District of Columbia, and for the 43 counties with greater than 1,000,000 population, and log-linear models were fitted to the resulting data plots.
Results:
Links to graphs of overdose deaths for all 50 states, the District of Columbia, and 40 large counties (pop. >1 million) are provided below.
Inquiries:
For questions or comments contact Michael Mallon at MSM126@pitt.edu or 412-624-5163.
States
Large Counties (Population Greater than 1 Million)